Mid-Market Executive Pay Shows Momentum
CEO and CFO compensation reflects a 'modest but positive year'

updated on Dec. 7, 2016
CEO compensation at middle-market U.S. companies rose by 3.2 percent last year to an average of $3.8 million, and CFO compensation rose by 4.1 percent to an average of nearly $1.5 million.
The BDO 600: 2016 Survey of CEO and CFO Compensation Practices of Mid-Market Public Companies report, released Nov. 15, examined CEO and CFO compensation at publicly traded companies with annual revenues from $100 million to $3 billion. The study used proxy statements filed between March 2015 and March 2016.
While the increases are moderate, mid-market executives fared better than employees overall, who received an average 2.9 percent salary increase in 2015.
"Executives at middle-market companies are cautiously bullish," said Randy Ramirez, managing director in the global employer services practice at accounting and consulting firm BDO USA, which conducts the annual survey. "Compensation increases reflect a modest but positive year, and despite a few economic challenges and uncertainty around election outcomes, 2016 growth may even be better."
Among the findings for 2015 total compensation:
- Technology and health care CEOs were the highest paid among the eight industries analyzed. Amid continued investor and consumer scrutiny, financial services—banking CEOs were the lowest paid, despite reporting the highest increase in pay from the prior year.
- The majority of CEOs' pay packages—63 percent—came in the form of long-term incentives, emphasizing the importance of performance. CFO pay was more evenly split—with 55 percent in long-term incentives and 45 percent in annual cash.
- Total compensation for CFOs averaged about 38 percent of total CEO pay.
Mid-Market CEO and CFO Pay 2015 total compensation and percentage change from 2014 |
| Sector | CEO Pay | Change | CFO Pay | Change |
| Technology | $5,691,652 | 19% | $2,006,873 | 13% |
| Health care | $5,068,727 | 2% | $1,667,624 | -5% |
| Real Estate | $5,052,096 | 0% | $1,910,658 | 4% |
| Energy | $4,197,580 | -4% | $1,806,917 | -6% |
| Financial Services—Nonbanking | $3,632,586 | 6% | $1,291,575 | -6% |
| Manufacturing | $3,214,750 | 2% | $1,237,240 | 9% |
| Retail | $2,968,313 | -4% | $1,255,812 | 38% |
| Financial Services—Banking | $751,174 | 8% | $388,651 | 8% |
| Source: BDO USA. | | | | |
"Executive compensation plans continue to be hotly debated as industries like financial services and health care grapple with increased scrutiny from stakeholders, lawmakers and consumers, with continued calls for even more transparency," said Ramirez. "We expect performance metrics will continue to grow in importance, as will communication plans to help earn shareholder approval."
[SHRM members-only toolkit: Designing Executive Compensation Plans]
Higher Pay and Higher Risk in Larger Companies
While total compensation is highest at larger companies in the middle-market space, so too is the proportion of variable compensation in the form of bonuses, stock and long-term incentives:
*Among larger companies in this space, just 15 percent of CEO pay is salary versus 24 percent at smaller mid-market companies.
*For larger mid-market CFOs, 22 percent of pay is salary versus 34 percent at smaller companies.
CEO and CFO Pay in 2015 by Company Revenues
| | | |
| Company Size | CEO Pay | CFO Pay |
| $100 million - $500 million | $2,324,230 | $964,824 |
| $500 million - $1.25 billion | $4,035,853 | $1,425,502 |
| $1.25 billion - $3 billion | $5,187,866 | $1,994,808 |
| Source: BDO USA. | | |
C-Suite Pay at Mid-Market Private Firms
Also released in November was The CFO Alliance's 2016/2017 Mid-Market Executive Compensation Survey. Earlier this year the alliance polled a sample of its members—CFOs and other executives in middle-market organizations (75 percent private, 13 percent public and 12 percent nonprofit); 188 organizations participated and provided detailed information on their compensation programs.
The table below provides aggregated values for base salaries by position. The 2015 column reflects the average values from the previous year's report for each position.
Base Salary Source: The CFO Alliance. |
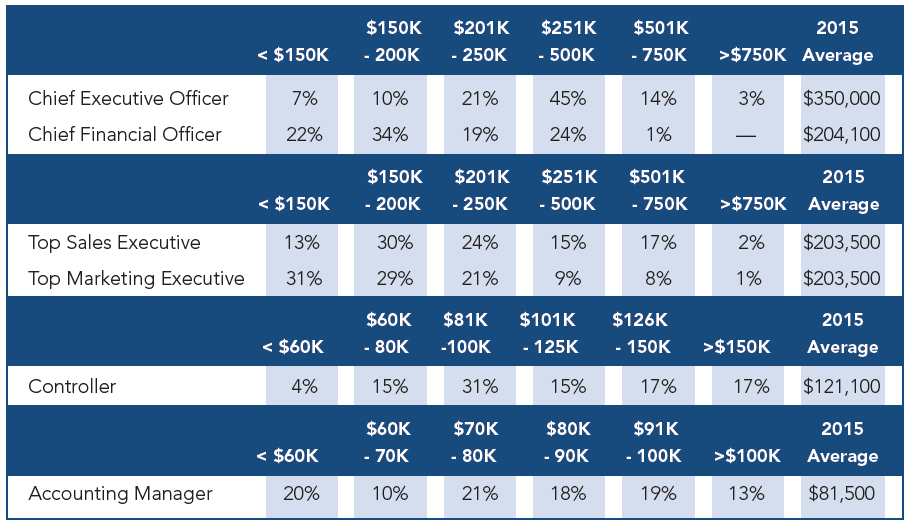
Key observations from the report:
- The base salary of CEOs is notably higher relative to CFOs, especially in examining those in the upper 25 percent of base salary compensation for each position.
- The base salary of accounting managers relative to controllers compares favorably when looking at those in the upper 35 percent of base salary compensation for each position.
The table below provides aggregated values for short-term incentives (STI) by position. The 2015 column reflects the average values from the previous year's report for each position.
Short-Term incentives Source: The CFO Alliance. |
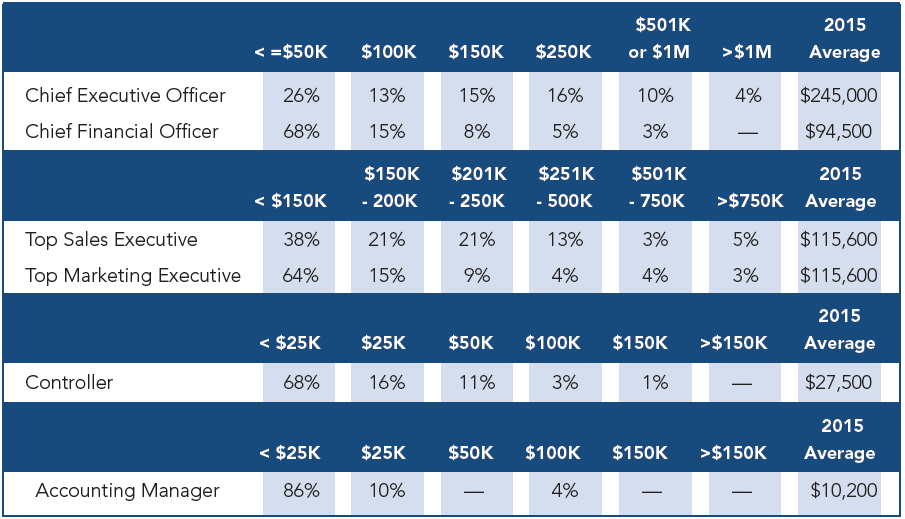
Key observations from the report:
- The STI compensation for CFOs is much lower than expected relative to top sales executives, most notably in that almost 70 percent will receive less than $50,000 in 2016.
- Relative to 2015, the STI compensation of controllers in 2016 is expected to be noticeably lower than the 2015 average; 68 percent of controllers will receive less than $25,000 while the 2015 average was $27,500.
- The STI compensation of top sales executives is notably higher relative to top marketing executives, especially in examining those in the upper 15 percent of base salary compensation for each position.
STI plan types, in descending order of frequency, included:
- Discretionary bonus.
- Annual incentive plan.
- Spot awards.
- Profit-sharing plan.
- Project bonus.
- Team/small-group incentives.
STI performance metrics, in descending order of frequency, included:
- Net income/earnings.
- Revenue.
- Individual goals or individual performance rating.
- Cash flow.
- Customer satisfaction.
- Employee satisfaction or engagement.
- Customer retention (customer churn).
- Return on equity, assets or investment.
STI incentive plan performance targets, in descending order of frequency, included:
- Budget.
- Management discretion.
- Year-over-year improvement.
- Formula.
- Milestone achievements.
- Performance relative to peer benchmarks.
The table below provides aggregated values for long-term incentives (LTI) by position. The 2015 column reflects the average values from the previous year’s report for each position.
Long-Term incentives Source: The CFO Alliance. |
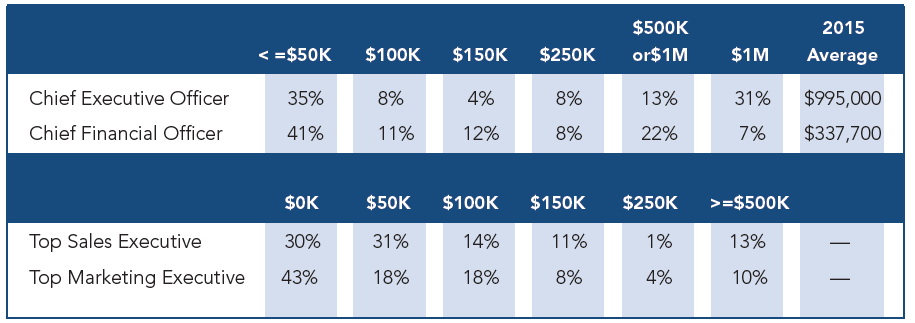
Key observations from the report:
- The LTI compensation of CEOs is notably higher relative to the CFO especially in examining those in the upper 25% of base salary compensation for each position.
LTI compensation programs offered, in descending order of frequency, included:
- Stock options.
- Restricted stock.
- Phantom stock.
- Long-term cash plans.
- Stock appreciation rights.
- Performance units.
- Performances Shares.
LTI performance metrics, in descending order of frequency, included:
- Revenue/annual sales.
- Profitability of earnings.
- Other nonfinancial-metric criteria.
- Cash flow.
- Return on equity, assets or investment.
- Client/customer satisfaction.
- Market share.
An executive summary of The CFO Alliance study results is available for download here. To request a copy of the full 34-page survey report, contact Greg Wood at Greg.Wood@thecfoalliance.org.
Was this article useful? SHRM offers thousands of tools, templates and other exclusive member benefits, including compliance updates, sample policies, HR expert advice, education discounts, a growing online member community and much more. Join/Renew Now and let SHRM help you work smarter.
Related Content

As artificial intelligence technology continues to develop, the demand for workers with the ability to work alongside and manage AI systems will increase. This means that workers who are not able to adapt and learn these new skills will be left behind in the job market.

A vast majority of U.S. professionals say students entering the workforce should have experience using AI and be prepared to use it in the workplace, and they expect higher education to play a critical role in that preparation.
Advertisement

An organization run by AI is not a futuristic concept. Such technology is already a part of many workplaces and will continue to shape the labor market and HR. Here's how employers and employees can successfully manage generative AI and other AI-powered systems.
Advertisement