Visual Leadership: An Innovative Approach to Leading Hybrid Teams
For most leaders, the ability to think and communicate visually is an untapped superpower. Here’s how to leverage the power of visuals—and the Passion/Skill Matrix—to lead your team to higher levels of performance.

Picture this: You are attending an executive leadership conference in New York City, seated in a large ballroom at one of those big round banquet tables alongside other CEOs, COOs, CFOs and CHROs from different companies when the facilitator (me) says the following:
“For this exercise, I’d like you to pair up with the person sitting next to you and explain to them—as simply, clearly and quickly as you can—your answers to the following three questions: What does your company do, what is your role and what is the single greatest business challenge you are currently facing? Oh … just one thing before you start: You need to do this without speaking.”
Dead silence and awkward confusion fill the room.
“So, um, how are we supposed to do this if we can’t speak?” someone finally blurts out.
To which I reply, as I walk around the room handing out large sheets of paper and multicolored markers, “How many of you have ever played Pictionary or Charades? Well, you are going to have this conversation with your partner only by drawing and gesturing! Don’t worry. If you can draw a straight line, a circle, a square or a triangle, then I trust you will be able to find a way to get your message across. Just keep in mind that this is not a test of your artistic abilities; it is a test of your ability to think and communicate visually. And, as in any conversation, your primary objective is to get the other person to ‘see’ what you’re saying, as well as to see what they’re saying. OK, go!”
With that, this group of senior-level executives start sketching, pointing, gesturing and miming their way through the exercise. As I walked around, I was impressed with all the stick figures and scribbles, mindmaps and storyboards, and process diagrams, flowcharts, dashboards and question marks being used to communicate back and forth in near-silence. Each person struggled to be understood while suppressing their burning urge to speak.
Seven minutes in—which probably felt to them like 10 times as long—I ring a bell and tell them they could now speak. The silent room explodes in laughter, smiles and relief as they continue their conversations—verbally this time—filling in gaps, explaining their chicken-scratch drawings and continuing in their efforts to understand and then offer suggestions to one another regarding their respective business challenges.
During the debrief about 10 minutes later, I ask the group what this experience was like. One CEO responds by saying, “I’ve known this guy sitting next to me for 15 years, and I’ve heard him talk about his business problems numerous times. But until he sketched it out for me just now and used an analogy and an example to explain his situation, I never really understood how all the pieces fit together or where his roadblocks were. But now I totally get it, and I see how I might be able to help him.”
And that is the power of visual leadership in action.
What Is Visual Leadership?
In brief, visual leadership is the art and science of applying visual thinking and visual communication to the practice of management and leadership. In a nutshell, “visual thinking” is about thinking in pictures, while “visual communication” is about communicating with pictures. Both of these can be
done using any combination of visual imagery and visual language.
The goal of thinking and communicating visually is to be able to get an idea out of your head and into the heads of others so that they can “see” what you’re saying. And the art of being a more visual leader involves developing your ability to paint a picture with words and create a mental movie in the minds of others—to turn your leadership “visions” into reality.
While the opening story focused primarily on using drawing as a visual thinking and visual communication tool, visual leadership is much more than just that. There is a tremendous benefit to being able to grab a pen or marker and skillfully explain an abstract idea using a napkin sketch or whiteboard illustration. But it is also about using other visual tools, tips and techniques—including pictures and props, mental models and frameworks, metaphor and analogy, and visual storytelling—to bring your ideas to life.
What makes visual leadership so eye-opening to most leaders is that we tend to focus on words and numbers as we wonder why our messaging doesn’t land or stick. When you think about the “3 Fs” involved in any message—facts, figures and feelings—it is important to remember that, while the words and numbers are crucially important in terms of content and context, human beings are motivated and inspired not by words and numbers, but by emotion.
It’s one thing to formulate a vision that you can clearly see in your “mind’s eye.” It is another thing to be able to communicate that vision effectively in a clear and compelling way so that your team is motivated and inspired to act on it.

The goal of thinking and communicating visually is to be able to get an idea out of your head and into the heads of others so that they can ‘see’ what you’re saying. And the art of being a more visual leader involves developing your ability to paint a picture with words and create a mental movie in the minds of others."
4 Ways to Think and Communicate More Visually
There’s a classic leadership acronym that says “TEAM” stands for “together everyone achieves more.” But how can visual leadership help a team achieve more? One of the most effective ways is by leveraging these four methodologies that can help you to think and communicate more visually:
- Visual imagery and drawing.
- Mental models and frameworks.
- Metaphor and analogy.
- Visual storytelling and humor (if/when appropriate).
And, although I separated these methods into four categories for the purposes of clarity and comprehension, they often exist in combination.
For example, related to the subject of building and leading high-performing teams: We might describe a team as if they were a group of geese flying in a V formation. This would be both a visual image that we can picture in our minds and an analogy. We might say that there are times when the team would benefit from the “lead goose” dropping back into formation and letting someone else step up to take on the lead role.
Or, when it comes to a team-based model or framework, we might refer to Tuckman’s classic Four Stages of Team Development (forming, storming, norming and performing) to assess what stage in their evolution a team is currently at, what they need to do to move up the ladder to become a high-performing team and how hands-on or hands-off the leader needs to be depending on the stage.
As for team-related analogies, in addition to the geese, other examples might include comparing a particular team to a school of fish, a colony of bees, a herd of buffaloes or a pack of wolves—each conveying a very different team persona and identity.
And, lastly, as a leader, if you were to tell your team a story about either the best or the worst team you’ve ever been on—or the best or worst boss you’ve ever worked for—this would be a powerful way of conveying your core values, as well as sharing some valuable leadership lessons learned.
So, when leading a hybrid team, instead of relying solely on words and numbers, consider taking a more visually oriented approach by leveraging the power of visual imagery, mental models, frameworks, metaphors and stories. Doing so will enable you to think more creatively and to communicate with greater impact and influence, leading to increased understanding, higher levels of trust, and enhanced individual and team performance.
And, of all the various tools in my “visual leadership toolkit,” I’ve found that one of the most powerful and transformative is my Passion/Skill Matrix model.
The Passion/Skill Matrix: A Case Study
The phrase “thinking outside the box” has become somewhat of a cliche. But the truth is that we can’t think outside the box until we have a box with something in it, which is why the use of four-box matrices is such a common tool in the business world. A four-box matrix creates a framework by which we are better able to sort through the messiness and complexity of a situation. This compartmentalization enables us to see things more clearly, assess possible solutions, make decisions and take action with greater efficiency, effectiveness and confidence—leading to better results.
Having delivered hundreds of leadership programs and team-building workshops over the past 20 years, I have experienced innumerable real-life examples of how visual leadership techniques, including mental models and frameworks, can enhance team performance, whether in person, remote or hybrid.
And the Passion/Skill Matrix is one such example: Several years ago, I was brought in by a large global pharmaceutical company to facilitate a three-day team-building event offsite for one of their departments. This group had been battling serious problems related to low levels of employee engagement, poor morale, high turnover and diminished productivity. The 20 members of this hybrid team were not happy with the status quo for a variety of reasons, ranging from general disengagement and feelings of stagnation to a lack of professional development and a sense of hopelessness regarding upward mobility.
And based on these symptoms, I had a strong feeling that my Passion/Skill Matrix model might help this team diagnose the root causes of some of these problems and potentially offer some solutions. I walked them through a series of seven steps.
Step 1: Create a master list of tasks. Each team member individually makes a list of all the things they spent time on over the past three months, using their calendars, project lists and task lists for reference.
Step 2: Put the tasks into four categories. Take that list of tasks and responsibilities and place them into these four categories: things you are good or great at, things you are not good at, things you like or love doing, and things you don’t like to do.
Step 3: Score each item. Quantify each task or responsibility on a Skill continuum from “I’m terrible at it” (0) to “I’m amazing at it” (10) and a Passion continuum from “I hate it” (0) to “I love it” (10). Each task will fall into two categories.
- Things you are good or great at (5-10 score).
- Things you are not good at (0-5 score).
- Things you like or love doing (5-10 score).
- Things you don’t like doing (0-5 score).
Step 4: Create your own Passion/Skill Matrix. Take all of the scored items from the list in Step 3 and plot them onto their own Passion/Skill Matrix worksheet. Based on those four scoring categories, each task/responsibility should fall into one of these four quadrants:
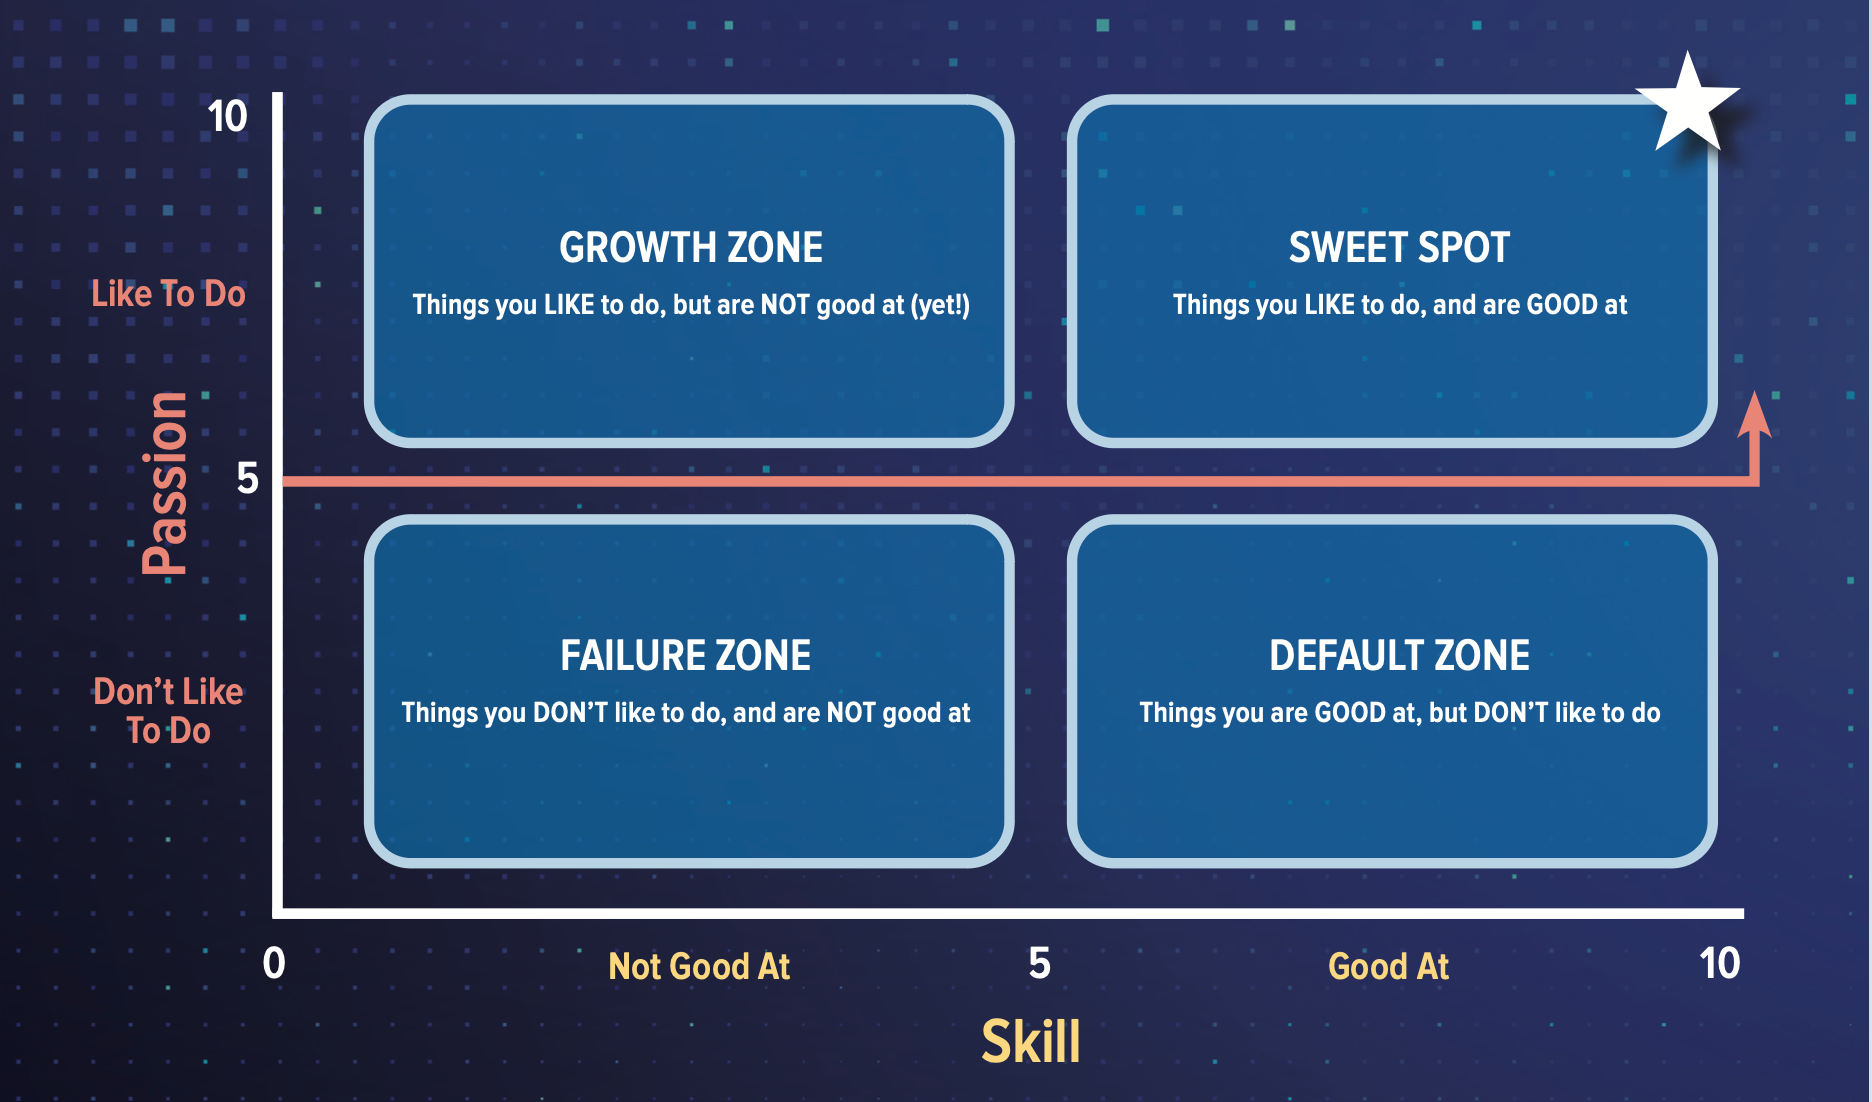
- The Sweet Spot (upper right quadrant): These are the things that you like or love to do and that you are good or great at. If you have a lot of items listed in that box, you’re incredibly lucky! Try to spend as much time as possible on these things. This is where the intersection of your skills and your passions lie, and it is also where you have the greatest potential to leverage your strengths and go from good to great. When you’re working on things that fall into this category, time flies, ideas flow, your energy is high and you’re in your element.
- The Growth Zone (upper left quadrant): These are the things you like or love to do but are not good or great at … yet. These are your primary development opportunities. Why? Because if you have a passion for something, or even a curiosity, and you feel that you may have an aptitude for it, you are more likely to work at it by learning more about it, studying, practicing, even failing, and seeking training and coaching in these areas. In this box, you never know how far you might get unless or until you try. Notice the powerful difference between saying “I’m not good at this” vs. “I’m not good at this … yet.” By adding that simple word, you open up a world of possibilities.
- The Default Zone (lower right quadrant): These are the things you don’t like to do but are good or even great at. Perhaps they are things you used to like doing or tasks for which you became the go-to person by default. Perhaps people even think that you enjoy it and welcome these opportunities, but you don’t. Unfortunately, many people spend most of their workdays in this quadrant, often leading to low levels of engagement. You can do many of these tasks in your sleep—and that is exactly the problem. This is often the start of “quiet quitting.” Perhaps some of the tasks on your list can be a development opportunity for someone else! Here is where you might be able to outsource, delegate, or take on the role of a mentor or coach to help someone else develop their skills in this area, thereby freeing you up to spend more time “above the line” in your Growth Zone and Sweet Spot.
- The Failure Zone (lower left quadrant): Lastly, these are things you don’t like (or even hate) to do and are not good at (perhaps, even terrible). You need to do whatever it takes to get out of this box as soon as you can. We all have aspects of our jobs that we may not love and may not be great at. But if you are spending a lot of time doing things that fall into this box, you are setting yourself up for a whole lot of pain and suffering and extremely high levels of disengagement as you seek to avoid failure by hiding and avoiding. If you’re in a job that you truly dislike and are not good at—and you don’t see a way to either improve your performance or develop your skills and stop hating what you’re doing—then you are not doing your employer, your team or yourself any favors by continuing to function in this capacity. It’s not sustainable, and it will eventually take its toll on your physical and mental health and well-being. This box can easily feel like a prison cell, so you need to try to get yourself out of it as soon as you can.
Once employees understand the Passion/Skill Matrix and see their own tasks and responsibilities carved up in each quadrant, this is where the power of visual thinking really kicks in—and the lightbulb usually goes on!
Each individual on the team can clearly see where and how every aspect of their job fits within this framework—and (generally) what percentage of their time they are spending in each quadrant. And when we correlate their matrix with their engagement scores, it is very clear that employees who spend a majority of their time (typically 70 percent to 80 percent) “above the line” in either their Sweet Spot or Growth Zone tend to be highly and actively engaged. Those who spend most of their time “below the line” in either their Default Zone or Failure Zone tend to be either not engaged or actively disengaged.
So, while this is extremely interesting and valuable information, what do we actually do with it to improve both individual and team performance?
Employees who spend a majority of their time (typically 70 percent to 80 percent) ‘above the line’ in either their Sweet Spot or Growth Zone tend to be highly and actively engaged. Those who spend most of their time ‘below the line’ in either their Default Zone or Failure Zone tend to be either not engaged or actively disengaged."
Step 5: Share your matrix. Now that each person has a greater understanding of their own matrix, how can we leverage these findings to raise individual engagement levels, address some of the aforementioned dysfunctions and take steps toward better team performance? You can achieve this by sharing some or all matrix examples with the rest of the team in a group discussion.
To be able to share, you will need to have created a culture and climate of psychological safety wherein members of the team feel comfortable and trusting enough with one another to be vulnerable and willing to share their responses. (Note: If everyone is not comfortable with sharing their personal matrix with others, it is OK to skip this step and go straight to Step 6.)
Step 6: Create a team matrix. Create one gigantic, wall-sized team matrix with each participant represented by a different color marker. This colorful visual communication tool helps to identify at a single glance a whole host of trends and patterns—both individually and collectively—including skills gaps, development needs, high-risk areas and so much more.
Step 7: Deconstruct and reconstruct employees’ roles and responsibilities. The final step—after hosting the offsite meeting, when the employees and team leaders have had an opportunity to process and consider all the findings—is to re-evaluate, redefine and revamp roles, responsibilities and job descriptions. The matrix should spark a focus on the training and coaching that is needed to help people turn their Failure Zones and Default Zones into Growth Zones and Sweet Spots.
As management guru Frederick W. Taylor once wrote, “People do best what they like best to do.” This half-day exercise contributed greatly toward identifying what each member of the team did best, as well as what they most liked to do.
So, the end result for this 20-person pharmaceutical team? Six months later, they reported a dramatic increase in employee morale, engagement and retention scores, plus a dramatic improvement in team productivity and an overall feeling of hope and optimism.
When it comes to engaging a hybrid workforce and building and leading higher-performing teams, one of my mottos is that “team bonding needs to come before team building, and you need to connect to each other if you want to work better with each other.” As such, you may find that taking a more visually oriented approach can help both you and your team “envision”—and achieve—a better future.

Todd Cherches is the CEO and co-founder of BigBlueGumball, a New York City-based leadership development and executive coaching firm. He is a member of Marshall Goldsmith’s MG 100 Coaches, an adjunct professor of leadership at New York University, a lecturer at Columbia University, a TEDx speaker and author of the book VisuaLeadership: Leveraging the Power of Visual Thinking in Leadership and in Life (Post Hills Press, 2020).
Related Articles

The proliferation of artificial intelligence in the workplace, and the ensuing expected increase in productivity and efficiency, could help usher in the four-day workweek, some experts predict.

Learn how Marsh McLennan successfully boosts staff well-being with digital tools, improving productivity and work satisfaction for more than 20,000 employees.

A vast majority of U.S. professionals say students entering the workforce should have experience using AI and be prepared to use it in the workplace, and they expect higher education to play a critical role in that preparation.