Women in the U.S. Workforce: Gains in Talent, Gaps in Leadership
The Economics of Work

The U.S. workforce is constantly in flux, shaped by forces such as immigration flows, an aging population, and changes in education that create new challenges and opportunities for organizations. Among the most transformative developments over the past 75 years is the dramatic rise of women in the workforce, a shift that has fundamentally reshaped the country’s economy.
Historic Growth Levels Off
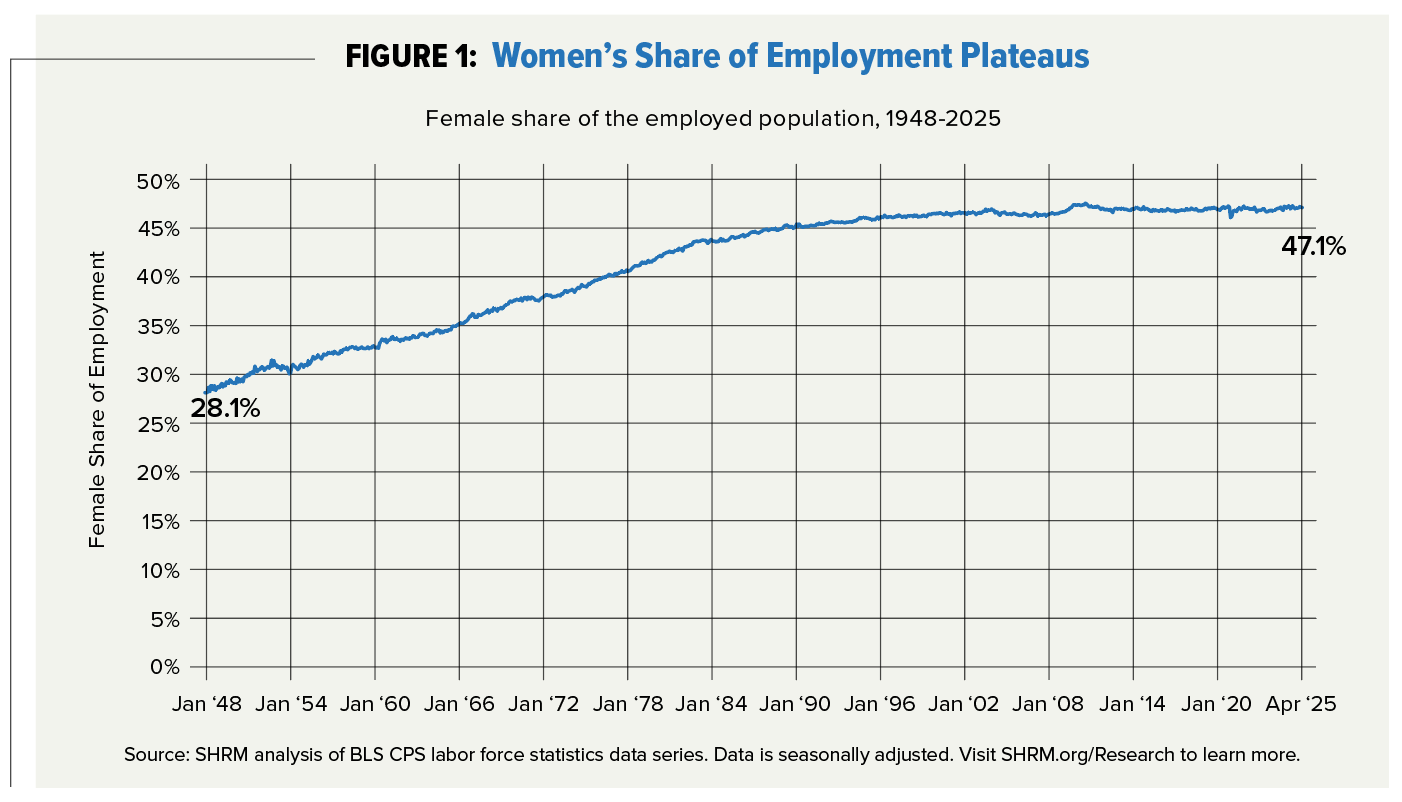
One of the most prominent consequences of this transformation is that women now account for a much larger fraction of the employed population. As shown in Figure 1, female representation in the employed population has risen from just 28.1% in January 1948 to 47.1% in April 2025.
The vast majority of these gains occurred in the latter half of the 20th century, particularly from the 1950s through the 1980s, as cultural norms shifted, educational access expanded, and economic necessity drove higher labor force participation among women.
This trend continued during the 1990s, albeit at a much slower pace. But in the 21st century, the share of employed people who are female has nearly always hovered within a percentage point of the April 2025 value of 47.1%. This two-decade plateau suggests that while women have reached near-parity in overall employment, further gains in representation may depend less on labor force entry and more on progress within occupations, industries, and leadership roles.
Women Dominate in Some Fields, Lag in Others
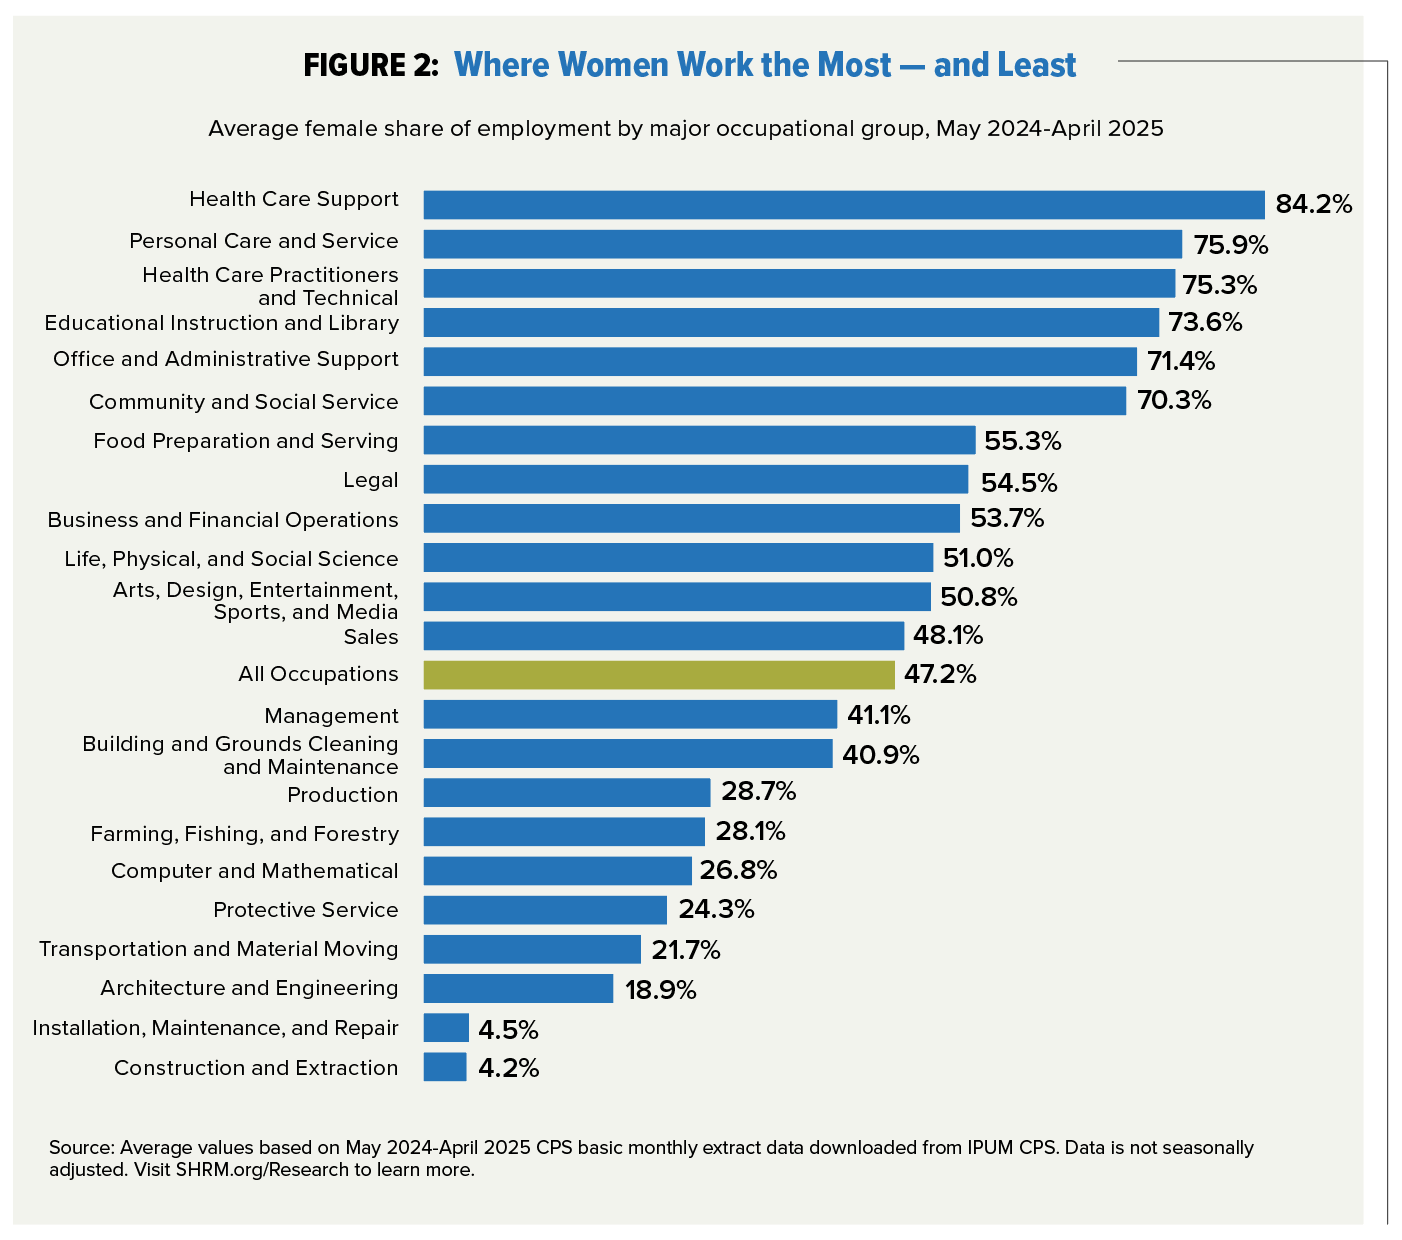
While women now reliably account for about 47% of the employed population, that participation is not evenly distributed. In fact, Figure 2 reveals that the average female share of employment in major occupational groups over the past year varied from a low of 4.2% (construction and extraction) to a high of 84.2% (health care support).
On the upper end of the spectrum, women accounted for more than two-thirds of employment in six major occupational groups, mostly concentrating on health care, education, and administrative services. In both major health care occupational groups, women hold more than 75% of the jobs. On the opposite end, women accounted for less than 30% of employment in eight major groups, including less than 5% of employment in positions related to installation, maintenance, and repair and construction.
Broadly speaking, the groups lying at either extreme reinforce some commonly held stereotypes about the types of jobs that are “male” or “female.” For example, this data shows that women play a dominant role in health care, education, personal care, office/administrative support, and community/social services, while men account for a substantial majority of employment in occupations that emphasize production, manual labor, protective services, and computers and mathematics.
It is critical to note, however, that women still account for at least one-fifth of employment in 19 of 22 major occupational groups, underscoring the vital role they play in every corner of the modern labor market.
Despite this broad-based representation in the employed population, evidence suggests that significant barriers remain to women participating and succeeding in certain jobs. For example, even though gains have been made over time, female representation in many science, technology, engineering, and math (STEM) occupations continues to lag. Over the course of the past year, average female representation was just 26.8% in computer and mathematical occupations and only 18.9% in the architecture and engineering group.
Gender Gaps Widen in Leadership Roles
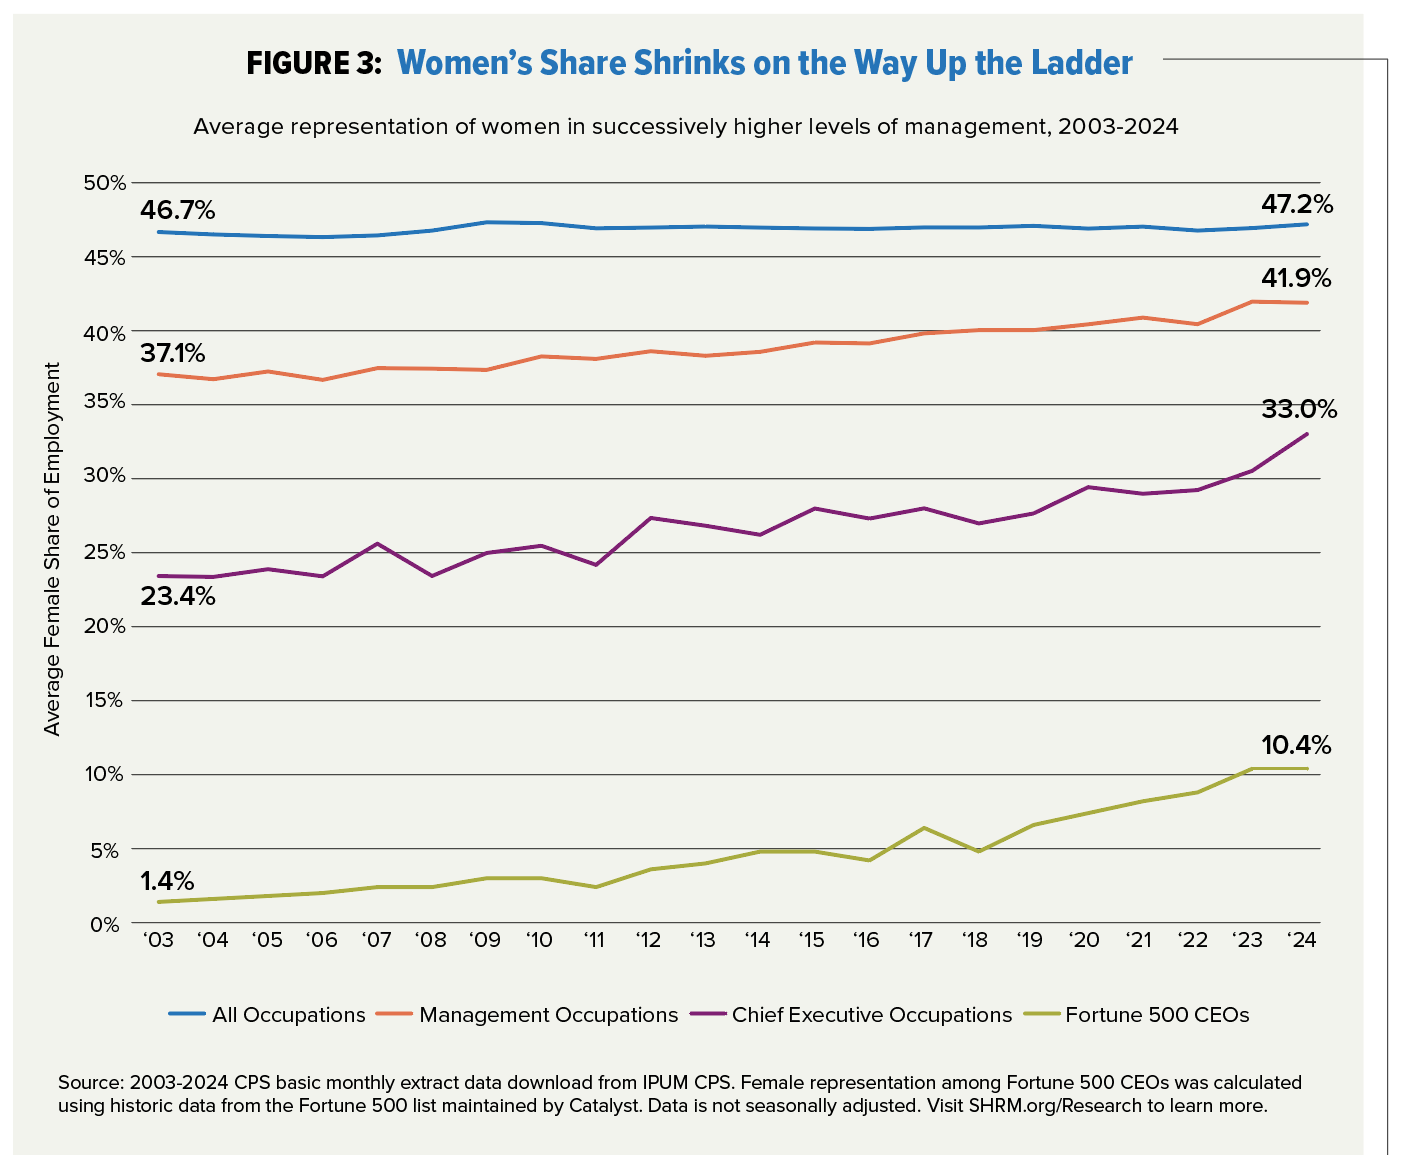
Female representation also remains relatively low in management occupations, particularly in more senior roles. Figure 3 illustrates this by plotting average female representation from 2003 to 2024 in overall employment, management occupations, chief executive roles (any C-suite or top-tier leadership role), and Fortune 500 CEOs. Two key points stand out in this analysis:
- Representation falls as rank rises. Female representation progressively declines at increasingly senior levels of management. While 47.2% of all U.S. workers were women in 2024, women accounted for only 41.9% of workers in management positions. Furthermore, within the management group, average female representation among chief executive roles was just 33%, and only 10.4% of Fortune 500 CEOs were women.
- The 20-year trend shows progress. Even though women continue to be comparatively underrepresented in management occupations (especially in more senior roles), female representation in management has been increasing over time. This is particularly true at more senior levels. For example, average female representation among chief executives rose from 23.4% in 2003 to 33% in 2024. And the percentage of Fortune 500 CEOs who are women rose from just 1.4% to 10.4% during that same period.
The Competitive Edge of Advancing Women
This data illustrates that women have become an indispensable part of the modern workforce, so much so that they now account for the vast majority of workers in a number of large occupational groups. At the same time, it is equally clear that female workers continue to remain relatively uncommon in a wide variety of roles.
In an environment characterized by enduring labor shortages and fierce competition for talent, organizations that attract workers from previously underutilized populations and empower those workers to succeed at all levels will enjoy an enormous competitive advantage that promises to grow over time. Given that women already represent nearly half of all workers, the imperative to maximize the contributions of this population is especially clear.

Justin Ladner is the senior labor economist at SHRM.
Related Articles

Learn how Marsh McLennan successfully boosts staff well-being with digital tools, improving productivity and work satisfaction for more than 20,000 employees.

The proliferation of artificial intelligence in the workplace, and the ensuing expected increase in productivity and efficiency, could help usher in the four-day workweek, some experts predict.

As artificial intelligence technology continues to develop, the demand for workers with the ability to work alongside and manage AI systems will increase. This means that workers who are not able to adapt and learn these new skills will be left behind in the job market.