OUR PERSPECTIVES
Purpose
Although the ongoing artificial intelligence boom has already existed for several years, its importance to the current and future state of work only appears to be accelerating over time. One consequence of this has been a growing focus on AI as a means to displace labor through automation, to the point where AI is often framed as having that explicit purpose. This perception has been fueled in part by the grandiose assertions of some AI executives, such as Anthropic CEO Dario Amodei’s repeated claims that the proliferation of AI tools will create a historically unprecedented labor market shock, resulting in mass displacement and chronic unemployment for millions of people.
Nothing approaching this has come to pass, but organizations have undoubtedly begun thinking of AI adoption as a pathway to workforce reduction, and some have even taken concrete steps in that direction. In fact, an April 2026 report published by Challenger, Gray & Christmas concluded that, while overall job cuts were down in the first quarter of 2026, AI was an important driver of the cuts that were made. To illustrate this point, the report noted that, “In March [2026], Artificial Intelligence (AI) led all reasons for job cuts, with 15,341 announced during the month, 25% of total cuts.”
As the relationship between AI, automation, and job displacement grows ever more complex, the public discourse on all three topics has become increasingly intertwined and confused. At the same time, research on the topic has failed to reach any consensus, with estimates of AI and/or automation exposure in whole occupations and individual work tasks varying widely.
In response to this uncertainty, SHRM embarked on a multiyear research effort in 2025 that seeks to bring clarity and provide a source of timely, objective data on automation, AI, and job displacement risk. This includes providing recurring, occupation-level estimates for the prevalence of task automation, AI usage, nontechnical barriers to automation displacement, and automation displacement risk based on large-scale surveys of U.S. workers. The 2026 SHRM Automation/AI Survey was fielded in spring 2026 to renew our original 2025 estimates and break new ground in the study of automation, AI, and job displacement risk in U.S. employment. This data brief covers the headline results stemming from this new wave of data.
KEY FINDING NO. 1
20% of Employment is at Least 50% Automated

A central goal of this analysis is to estimate the share of employment in individual occupations and aggregated occupational groups of interest that face “high automation displacement risk,” which we define as existing in any given job when two key conditions are met. The first of these is that at least 50% of the tasks in the job are already automated. Figure 1 reports the estimated share of employment in each major occupational group that meets this threshold.
Overall, we estimate that 20% of U.S. employment (about 31.1 million jobs) is currently at least 50% automated. As one would expect, this share varies widely across occupational groups, from a low of 8.9% (personal care occupations) to a high of 51.2% (computer and mathematical occupations). As was the case in our 2025 findings, a task automation percentage of 50% or more is especially common in the computer and mathematical group, though we estimate that at least one-quarter of employment meets this threshold in six additional groups. With the exception of construction and extraction occupations, all of these groups represent white-collar occupations in which task automation has likely risen due to the rapid proliferation of AI tools in the workplace.
On the opposite end of the spectrum, we estimate that fewer than 12% of jobs have task automation levels at or above 50% in four major occupational groups, including education and library (11.7%), health care support (11.6%), food preparation and serving (10.8%), and personal care (8.9%). These results also align closely with our expectations because occupations in these groups tend to heavily emphasize tasks that would be difficult or very expensive to automate, in part because a significant fraction of these tasks center heavily on interpersonal interactions. This issue of expense is further compounded by the fact that many occupations in these groups are relatively low paying, which would tend to reduce the cost effectiveness of investing in automation.
In comparing these findings to our 2025 results, we find that the share of employment that is highly automated has risen in nearly every major occupational group, often by a significant amount. For example, just 32% of employment in the computer and mathematical group was at least 50% automated in our 2025 estimates, nearly 20 percentage points below the equivalent 2026 share.
As dramatic as some of these increases are, there are several plausible explanations. First, the rapid proliferation of AI tools designed to automate work tasks is undoubtedly driving a real increase in task automation in a wide range of jobs, particularly within the white-collar groups that appear at the top of Figure 1. Second, the rise of these tools has likely increased workers’ awareness of automation, so that respondents to our 2026 survey were less likely to overlook the role that automation plays in their job. Whatever the reason for this shift, our updated estimates suggest a substantial rise in highly automated employment relative to our 2025 findings, which raises the possibility of a corresponding rise in automation displacement risk.

Seminar
Workforce Planning: The Future of Work
With roughly 31.1 million jobs now at least half automated, HR teams need a clear method for anticipating talent needs. This seminar helps you map where automation reshapes roles and plan staffing decisions with confidence.
KEY FINDING NO. 2
21% of Employment is at Least 50% Done Using AI Tools
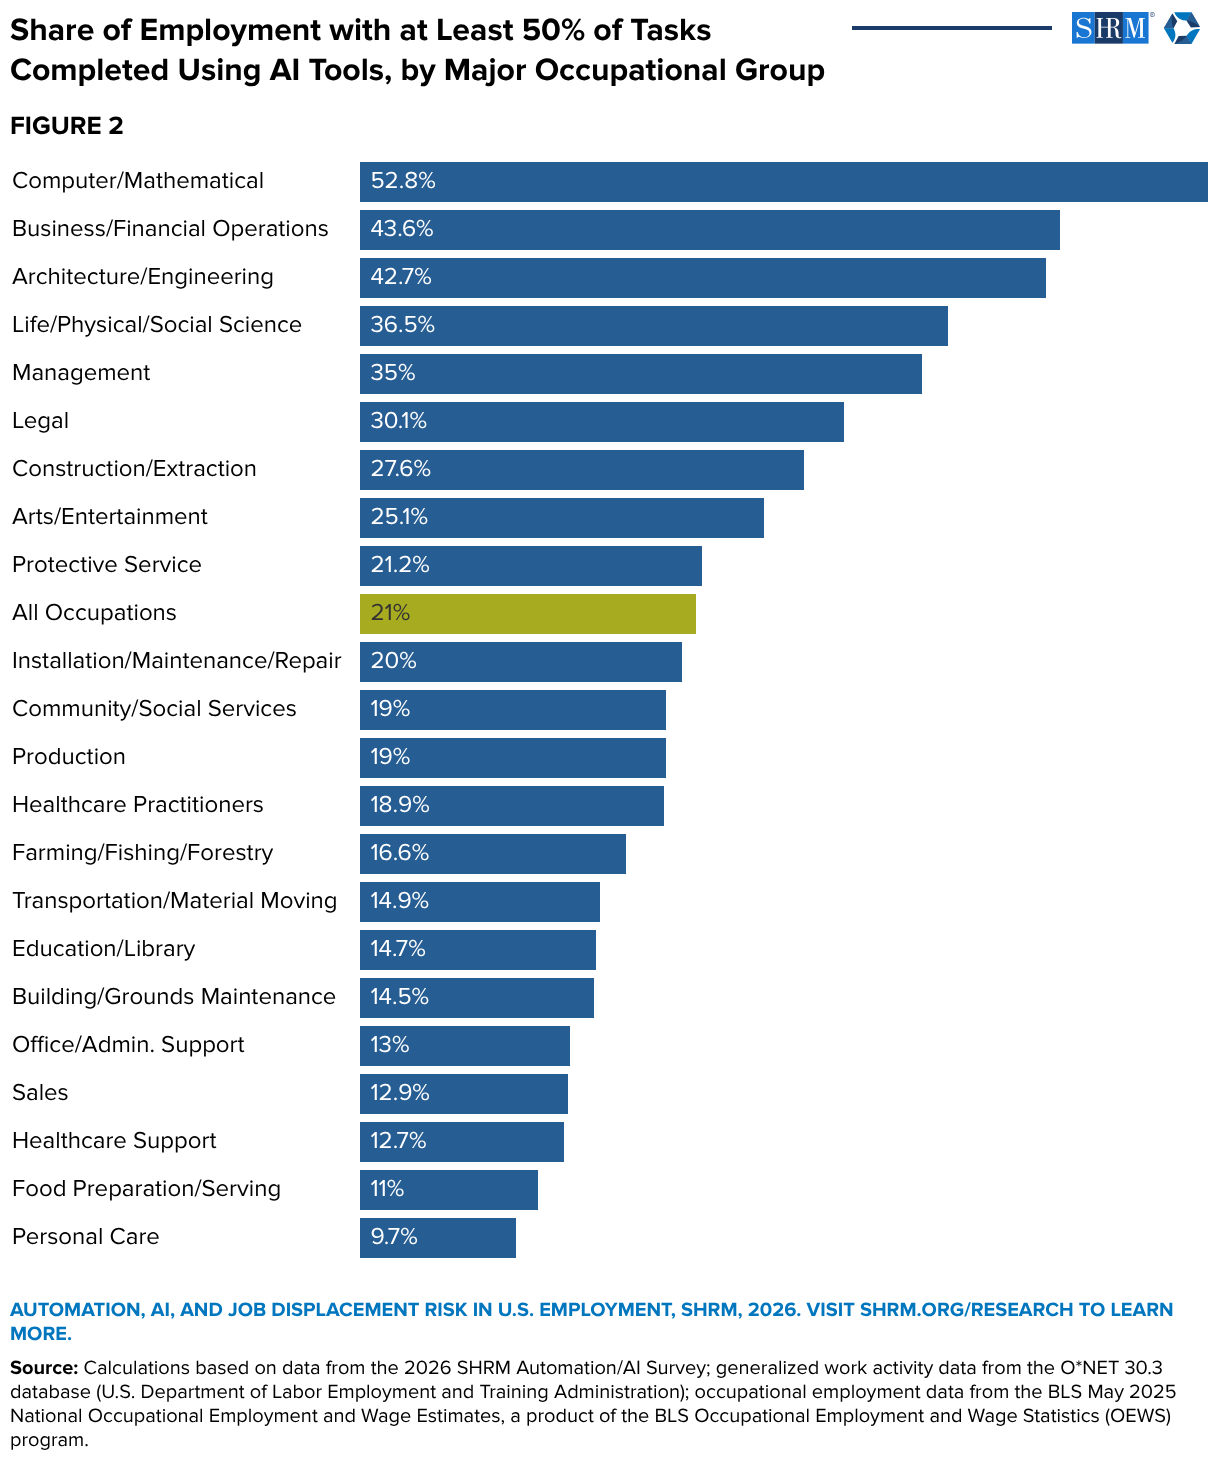
AI use to complete work tasks does not directly factor into our final estimate of automation displacement risk. However, examining the prevalence of high AI tool use (i.e., completing at least 50% of tasks using AI tools) is relevant because the ongoing boom in AI development and proliferation has often been fundamentally connected to task automation, particularly (though not exclusively) in white-collar occupations. Figure 2 does this by reporting the estimated share of employment in which at least 50% of tasks are completed via AI tools, by occupational group.
Overall, our estimates suggest that at least 50% of tasks are done using an AI tool in 21% of U.S. employment (32.6 million jobs). Once again, we see tremendous variation across occupational groups, from a low of 9.7% of employment in personal care occupations to a high of 52.8% in computer and mathematical occupations. Critically, all six of the top groups represent white-collar occupations that heavily emphasize tasks involving writing, communication, data collection and analysis, routinized business processes, and decision-making. AI tools developed over the last several years are specifically catered toward completing these kinds of tasks, so it makes sense that high AI tool use would be extremely common in these groups.
In contrast, we estimate that fewer than 15% of jobs exhibit high AI tool use in eight of 22 major groups, including particularly low employment shares in personal care (9.7%) and food preparation and serving (11%) occupations. A consistent theme in occupations for which we estimate AI tool use to be low is a strong emphasis on inherently human, often physical tasks (e.g., serving food or cutting hair).
Another key issue is that our estimates tend to suggest that the prevalence of high AI use is strongly correlated with computer use in general, which makes sense but also highlights a fundamental caveat to bear in mind when interpreting these results. In short, the set of “AI tools” extends far beyond the limited number of programs that have become commonly associated with AI (e.g., ChatGPT), a fact underscored by the definition of AI used in our survey. This necessarily broad definition means that a surprisingly large share of employment exhibits high AI usage, even in occupations that one would tend to not associate with the AI boom. It also means that accurately measuring the extent and importance of AI tools in individual occupations is becoming complex, as AI features are increasingly intertwined with any kind of computer-based technology. Thus, many workers may report a high share of tasks completed with AI tools simply because much of their work relies on computers in some way. Such a report might be technically correct, but it may overstate how centrally important AI is in certain contexts.
As mentioned above, the rationale for exploring AI usage when estimating automation displacement risk is that the rise of AI tools in recent years has been inextricably linked to task automation. In other words, the rise of AI is commonly discussed as a driver of job displacement through automation. The combined findings of Figures 1 and 2 broadly support this conclusion because there is a strong positive correlation between the frequencies of high task automation and high AI usage.
A natural assumption stemming from these patterns is that high task automation and high AI usage are really two ways of conveying the same information, which is to say that AI tools are simply another vehicle through which task automation occurs. It is certainly true that individual respondents in our data tend to report highly correlated values for the share of tasks in their jobs that are automated or completed using AI tools; however, the underlying survey questions allow respondents to treat AI and automation as completely distinct concepts.
In fact, the joint responses of most survey respondents suggest that there is an explicit distinction between tasks that are automated and those that are done using AI, even if the two often overlap significantly. For example, among our 14,245 individual respondents, about 43.3% (6,175) reported a share of tasks completed using AI tools that is higher than their reported share of tasks automated, often by a substantial margin. This combination is consistent with AI being a tool for task augmentation, rather than being purely about automation. Similarly, many respondents reported the opposite (i.e., a greater share of tasks automated than done using AI tools), and only about one-fifth (21.6%) reported task automation and AI usage shares that are exactly the same. All of this suggests that, while AI is often a tool through which tasks are automated, this is far from universally the case.

Credential
SHRM AI+HI Specialty Credential
When 43.3% of respondents report using AI more than automation, the signal points to augmentation, not just replacement. This credential helps you pair artificial intelligence with human intelligence to shape how work gets done.
KEY FINDING NO. 3
60.4% of Employment has at Least One Nontechnical Barrier to Automation Displacement

The second condition that we require to classify a job as having high automation displacement risk is the absence of nontechnical barriers to displacement. The variety of nontechnical barriers that might exist is extensive, including clear-cut issues such as legal requirements (e.g., it’s against the law to fly a commercial airliner without a human pilot), as well as far less predictable barriers such as client preferences. Our 2025 results suggested that 63.3% of U.S. jobs include at least one nontechnical barrier to displacement, which significantly reduced the share of employment that we ultimately identified as facing high displacement risk.
Figure 3 summarizes our 2026 estimates for the prevalence of nontechnical barriers in employment, both overall and by major occupational group. In keeping with last year’s results, we find that these barriers are pervasive in U.S. employment, with an estimated 60.4% of jobs having at least one such barrier. However, outside of this superficial similarity, our latest estimates differ from their 2025 counterparts in critical ways.
First and foremost, the 2026 values are much more varied, with the share of employment having at least one nontechnical barrier ranging from a low of 49.6% in the food preparation and serving group to a high of 78.2% in the computer and mathematical group. In stark contrast, the range in this share across occupational groups in our 2025 results was much more compressed, with the lowest share (57.4% for the food preparation and serving group) being just 13.2 percentage points lower than the highest share (70.6% for the health care practitioners group).
The second fundamental difference is that our latest findings suggest a strong positive correlation between high task automation and the presence of nontechnical barriers to displacement, an association that did not exist in our 2025 findings. For example, the three top groups ranked by share of employment with at least 50% task automation in Figure 1 (computer and mathematical, architecture and engineering, and business and financial operations occupations) are also the three groups for which nontechnical barriers to displacement are most common. Similarly, nontechnical barriers are often less common in groups for which high task automation is comparatively rare (e.g., food preparation and serving, personal care, and health care support occupations). This is a fundamentally important result because it suggests that employment in many of the most highly automated occupations is also disproportionately shielded from automation-driven displacement due to the presence of nontechnical barriers.
As will be discussed in detail below, this relationship between nontechnical barrier prevalence and task automation profoundly influences our final estimates for high displacement risk, because the ubiquity of nontechnical barriers in occupations for which high task automation is common significantly depresses our assessment of displacement risk in those occupations.

Enterprise Solution
AI Enablement for HR
Nontechnical barriers slow displacement, but they don't pause adoption. This program gives your HR team readiness assessments, live expert training, and implementation guides to lead AI adoption thoughtfully across roles that face fewer barriers.
KEY FINDING NO. 4
Client Preferences Continues to be the Most Common Nontechnical Barrier to Displacement

When any given respondent to the 2026 SHRM Automation/AI Survey reported that at least one nontechnical barrier to job displacement was present in their current job, they were asked to identify the types of nontechnical barriers present. In addition to a free response “other” category, respondents were able to select any number of four specific barrier categories:1
- Legal or regulatory requirements (i.e., by law or regulation, my current job cannot be fully displaced by automation).
- Client preferences (i.e., my current job cannot be automated because my employer’s clients or customers prefer that a person is in my role).
- Cost-effectiveness (i.e., it is cheaper for my employer to use human labor in my current job).
- Organizational constraints (i.e., policies, business practices, or managerial decisions within my organization prevent my job from being displaced by automation).
As was the case last year, our updated estimates suggest that client preferences continues to be the single most common nontechnical barrier to job displacement, with an estimated 62.7% of jobs with at least one nontechnical barrier to displacement having a barrier related to client preferences. This finding intuitively makes sense and is consistent with recent news, including reporting from last year that the Swedish fintech company Klarna resumed hiring human customer service representatives after an attempt to move toward a fully automated AI tool was poorly received.
Although client preferences will almost certainly continue to be a dominant barrier to automation displacement, the rapidity with which preferences adapt means that this barrier is highly dynamic. In fact, our estimates from last year indicated that 73.6% of jobs with at least one nontechnical barrier to displacement faced a client preferences barrier, a share nearly 11 percentage points above our 2026 estimate. Exactly why the decline has occurred is not clear from the data, though a plausible explanation is that client preferences are rapidly evolving as AI becomes increasingly capable and ubiquitous. As a result of these shifts, workers may be becoming increasingly skeptical of the degree to which the value of interpersonal interactions with customers is a viable shield against displacement.
Relative to client preferences, the three remaining specific nontechnical barrier categories are significantly less likely to arise in jobs that have at least one nontechnical barrier, though all three are still quite common. Furthermore, unlike client preferences, these barrier types may prove to be very durable because removing them can be costly and time-consuming. For example, changing state and federal laws to remove legal barriers to automation displacement is uniformly time-consuming and often politically infeasible.

Seminar
Managing Change
Client preferences cite as a barrier in 62.7% of affected jobs, down from 73.6% in 2025. As those preferences shift, this seminar helps you navigate the organizational transitions that follow with confidence.
KEY FINDING NO. 5
5.1% of Employment Is at Least 50% Automated and Has No Nontechnical Barriers to Displacement
Because our survey asks respondents to report both the share of tasks in their current job that are automated and whether any nontechnical barriers to displacement are present, we can define a composite indicator for each respondent that captures whether their job meets the two conditions we require for high automation displacement risk to be present (i.e., at least 50% of work tasks are automated and no nontechnical barriers to displacement are present). Using this indicator, we generate occupation-level estimates for the share of employment in each occupation that faces high displacement risk. Having done so, we can then aggregate our occupation-level values to determine the prevalence of high automation displacement risk in any occupation-based group of interest.
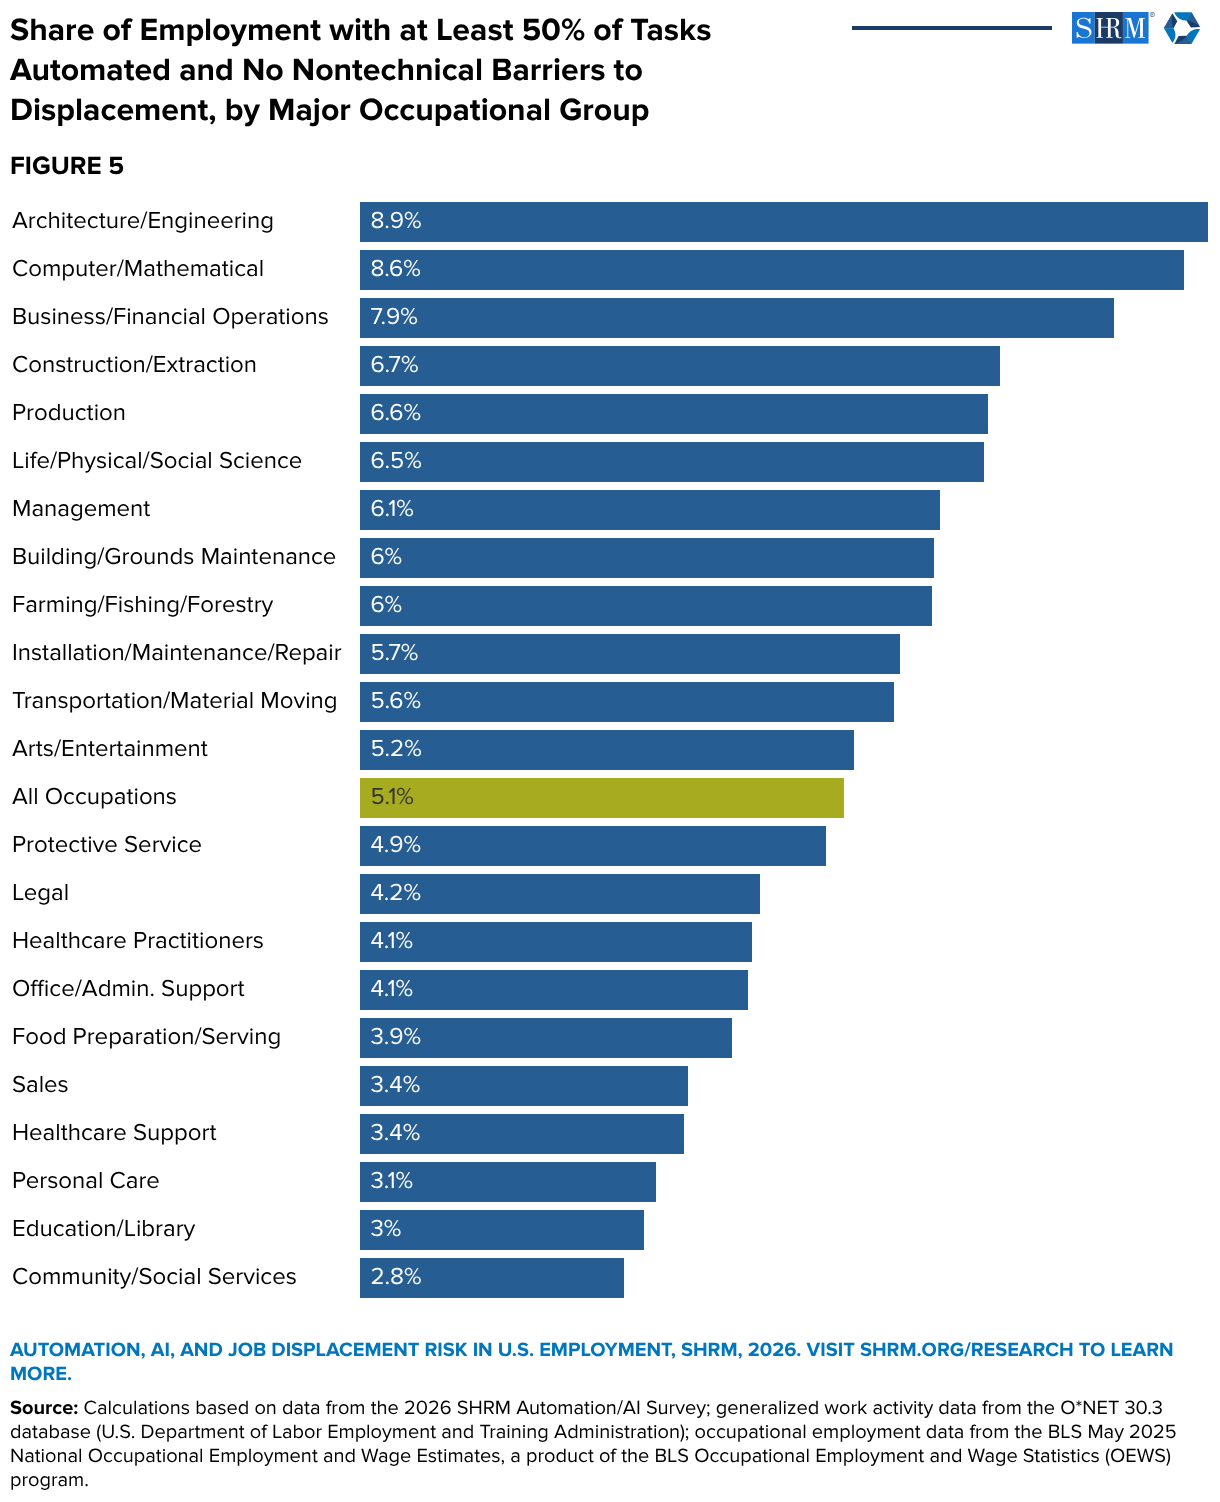
Figure 5 reports estimated shares of employment facing high automation displacement risk, both overall and by major occupational group. Our analysis suggests that about 5.1% of current U.S. employment (about 7.9 million jobs) falls into this risk category, with significant variation in exposure across occupational groups. On the high end, we estimate that at least 7.9% of employment faces high automation displacement risk in three major occupational groups (architecture and engineering, computer and mathematical, and business and financial operations occupations). As significant as these shares are, our Figure 1 results reveal that at least 40.8% of employment in all three of these groups is at least 50% automated. This would seem to suggest that many jobs in these groups should fall into the high displacement risk category. However, the near-ubiquitous presence of nontechnical barriers to displacement in all three groups dramatically mitigates the extent to which this is the case.
More generally, our 2026 estimates reveal a strong positive correlation between the share of employment in an occupation that is automated and the likelihood that that occupation has at least one nontechnical barrier to displacement, a pattern that was decidedly absent from the 2025 estimates. There are several likely factors behind this change. One plausible explanation is that the presence of nontechnical barriers to displacement may have risen so much in highly automated white-collar occupations because people in these occupations have been at the forefront of the current AI-driven automation boom. Due to their high exposure, workers in these groups probably have a more in-depth understanding of how these tools are used in the workplace, particularly regarding the necessity of human workers for particular tasks or in specific contexts. In other words, workers with greater exposure to emerging AI tools associated with automation may simply be more aware of the degree to which nontechnical issues make human labor indispensable in their roles.
On the opposite end of the spectrum, the occupational groups with the lowest shares of employment facing high displacement risk tend to be those in which crossing the 50% task automation threshold is comparatively rare, rather than an especially high likelihood of nontechnical barriers. This combination is especially evidenced by the five occupational groups for which we estimate that fewer than 3.5% of employment faces high displacement risk: sales (3.4%), health care support (3.4%), personal care (3.1%), education and library (3%), and community and social services occupations (2.8%).

Credential
SHRM Foundation Skills First Specialty Credential
With roughly 7.9 million jobs facing high displacement risk, talent decisions carry real weight. This credential equips you to validate workers' capabilities and apply skills-first strategies, so your organization can move people into the work that comes next.
KEY FINDING NO. 6
Labor Demand Has Declined More for Occupations With Higher Shares of Employment Facing High Displacement Risk Since November 2022
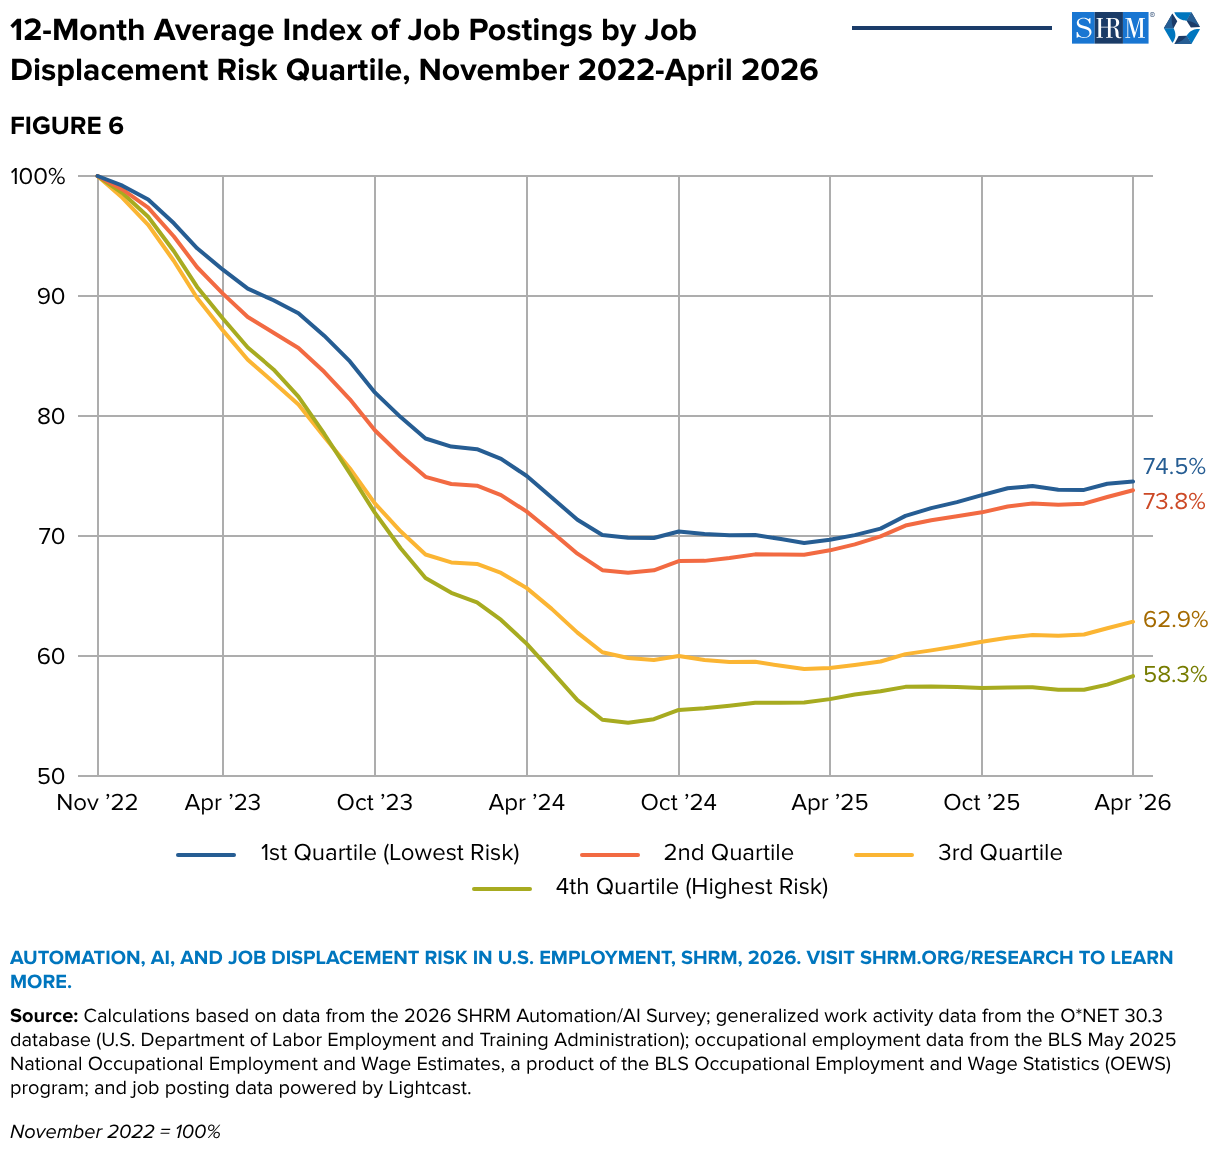
The analysis presented in this brief focuses on estimating automation displacement risk, as opposed to a direct forecast of actual displacement. Even so, it is possible to provide an initial assessment of the signaling value of our risk measures by examining the relationship between them and observed labor demand, as measured by job posting data. Figure 6 does this by dividing the 755 occupations for which we have Lightcast job posting data into displacement risk quartiles and tracking an index of 12-month average active job postings in each quartile from November 2022 (when ChatGPT was introduced — an intuitive starting point for the current AI boom) through April 2026 (the latest month for which data are available). In this analysis, each occupation’s displacement risk quartile is assigned according to its estimated share of employment facing high displacement risk, with higher quartiles containing occupations with larger shares of employment facing high displacement risk.
For each displacement risk quartile, the index plotted in Figure 6 reports the 12-month average number of active job postings in each month as a percentage of the 12-month average number of active job postings in November 2022. For example, in the first (i.e., lowest) quartile of job displacement risk, we find that the 12-month average number of active job postings in April 2026 stood at 74.5% of its November 2022 value.
November 2022 also coincided roughly with the peak of the pandemic-era labor market boom, so it comes as no surprise that labor demand has fallen across all job displacement risk quartiles since then. However, Figure 6 clearly shows that demand has fallen more in higher quartiles. In fact, while the 12-month average number of active job postings has only fallen by about 25% since November 2022 in the first and second displacement risk quartiles, the declines seen in higher quartiles approach or even exceed 40%. Put another way, we find that occupations with higher estimated shares of employment facing high displacement risk have also tended to see more dramatic declines in labor demand since November 2022. Though we cannot observe this directly, the patterns reported in Figure 6 are consistent with the idea that employers are adopting automation technologies that are driving down demand for occupations more highly exposed to automation displacement.
Although these results are compelling, it is important to take them with a healthy grain of salt. After all, the period of time covered in Figure 6 was characterized by historically unusual and often unpredictable labor market conditions. Furthermore, the occupations that we estimate face the highest displacement risk are concentrated in specific occupational groups and industrial sectors, so it is possible that the trends observed are the byproduct of forces specific to certain industrial sectors or occupational groups that have nothing to do with automation-driven job displacement. More time and data are needed to conclusively demonstrate a link between our measures of displacement risk and observed labor demand, but these initial findings clearly indicate that additional monitoring is warranted.

Event
The AI+HI Project
Displacement may stay limited, yet it could still reach millions of jobs over time. This event brings together AI pioneers, industry leaders, and hands-on workshops to help you navigate every stage of adoption.
CONCLUSION
This brief has introduced the 2026 edition of our SHRM Automation/AI Survey and provides updated estimates of key values initially reported in 2025’s Automation, Generative AI, and Job Displacement Risk in U.S. Employment report, with a particular focus on the share of employment that faces high displacement risk due to high current task automation and the absence of nontechnical barriers to displacement. Our findings support the conclusion that average task automation has risen notably over the last year; however, the share of employment that we estimate faces high displacement risk has actually fallen from 6% to 5.1%, with the latter value representing about 7.9 million jobs in the May 2025 BLS OEWS employment estimates. This decline can be attributed to a significant rise in the prevalence of nontechnical barriers to displacement in highly automated occupations.
Our findings continue to suggest that — at least in the immediate future — the complete displacement of workers due to advancing automation technology is likely to be limited as a percentage of overall employment and concentrated in specific contexts. However, even in this limited case, total displacement due to automation could still amount to millions of jobs in total, with some occupations facing significantly elevated risk.
Furthermore, our findings reinforce the conclusion that automation and AI tools have become absolutely central to work in many different occupations, as well as the expectation that these tools will become even more pervasive and indispensable over time. At the same time, this research underscores that workers’ perceptions of the importance of nontechnical barriers to automation displacement will likely be highly volatile for the foreseeable future. In an environment characterized by such rapid change, the importance of frequently analyzing data as well as reforming policies and business practices as needed has never been more apparent.
Definitions
U.S. employment: in the context of this research, “U.S. employment” is defined as wage/salary employment as measured by the U.S. Bureau of Labor Statistics’ (BLS) May 2025 Occupational Employment and Wage Statistics (OEWS) data. We specifically focus on the employment values reported for each of the 830 detailed occupations reported in the data. This definition of employment focuses on employees in nonfarm business establishments and consequently excludes certain types of workers (e.g., the self-employed).
Automation: the technique of making an apparatus, process, or system operate autonomously (i.e., without human intervention). One example would be manufacturing processes that complete routinized tasks without human input. A task is said to be “automated” if it is completed using an automation technology. The degree to which an occupation is automated depends on the extent to which tasks completed within that occupation are done via automation.
Job displacement: job displacement refers to the elimination of jobs filled by human workers. Though job displacement can occur for a variety of reasons, in the context of this research, our focus is on displacement arising from the replacement of human labor with automated processes.
Artificial intelligence: refers to technology that enables machines to mimic human intelligence, performing tasks such as learning, problem-solving, and decision-making. AI systems can adapt and improve based on data, often using techniques such as machine learning to evolve over time. The 2026 SHRM Automation/AI Survey specifically identifies the following types of AI:
- Generative AI: writes text, produces images, generates code, composes music.
- Predictive AI: forecasts outcomes, identifies probabilities, anticipates trends.
- Classification and detection AI: categorizes items, flags unusual behavior, recognizes objects or signals.
- Automation AI: performs actions, triggers steps, moves data, executes subroutines.
- Optimization and decision AI: recommends optimal schedules, routes, configurations, or actions.
- Agentic and autonomous AI: breaks problems into tasks, uses tools, takes actions independently.
Nontechnical barrier to displacement: a nontechnical barrier to displacement is any obstacle that would plausibly prevent human labor from being fully displaced by automation, even if the technology existed to do so. Nontechnical barriers can exist for both entire jobs and individual work activities.
High task automation: we refer to a job as having “high task automation” if at least 50% of the tasks in the job are automated (i.e., completed using an automated process). Generally speaking, the value we discuss in connection with this concept is the share of employment in a given occupation or set of occupations that meets this task automation threshold.
High AI usage: we refer to a job as having “high AI usage” if at least 50% of the tasks in the job are completed using AI tools. Generally speaking, the value we discuss in connection with this concept is the share of employment in a given occupation or set of occupations that meets this threshold for AI usage.
High automation displacement risk: we refer to a job as facing “high automation displacement risk” if at least 50% of the tasks in the job are automated (i.e., completed using an automated process) and there are no nontechnical barriers to displacement associated with the job. Generally speaking, the value we discuss in connection with this concept is the share of employment in a given occupation or set of occupations that faces high displacement risk because both of these conditions are satisfied.
Methods & Data
Data
The data used in this research come from several sources:
- 2026 SHRM Automation/AI Survey — see methods section for additional details.
- May 2025 BLS Occupational Employment and Wage Statistics (OEWS) Employment Data — this annual BLS dataset includes national estimates of wage/salary employment levels for 830 detailed occupations in the Standard Occupation Classification (SOC) system.
- O*NET Version 30.3 General Work Activities Module — the Occupational Information Network (O*NET) database is a publicly available database that describes occupations in the SOC system according to their observable characteristics. O*NET includes many modules, but we focus exclusively on the Generalized Work Activities (GWA) module, which includes 41 work activities. For every occupation, this module quantifies the importance of each work activity and the proficiency requirements associated with it. We use this information to construct an occupational similarity matrix that allows us to identify local GWA neighborhoods for each occupation, which is central to determining the subset of survey data to use for estimating values of interest for each occupation.
- BLS O*NET-to-SOC Crosswalk — although both are based on the 2018 SOC coding structure, the occupational codes used in the BLS OEWS and O*NET data are not exactly the same, mainly because the O*NET codes are eight digits long and the BLS OEWS data codes are six digits long. This crosswalk allows us to translate O*NET GWA data into the six-digit codes used in the BLS OEWS data.
- Job Postings Data Powered by Lightcast – Our examination of the relationship between high displacement risk and labor demand relies on proprietary monthly active job postings data obtained through Lightcast.
Methods
The estimation methodology used in this research will be covered in detail in a forthcoming methodological appendix. However, a quick summary of key steps is provided below:
Survey — the 2026 SHRM Automation/AI Survey was fielded in April 2026 with a final sample size of 14,245 U.S. workers. In addition to providing basic occupational information and demographic characteristics, respondents were asked a series of questions related to automation, AI use, and nontechnical barriers to automation displacement in their current jobs. This data brief focuses on four topics captured in the survey data:
- The share of tasks currently automated in the respondent’s current job.
- The share of tasks currently done using AI tools in the respondent’s current job.
- The presence of nontechnical barriers to automation displacement in the respondent’s current job.
- The types of nontechnical barriers to automation displacement in the respondent’s current job.
Occupation-level estimates — a central priority in the analysis underlying this data brief is to identify four values for each of the 830 detailed occupations in the May 2025 BLS OEWS employment data:
- The probability that at least 50% of tasks in a job in any individual occupation are automated.
- The probability that at least 50% of tasks in a job in any individual occupation are done using AI tools.
- The probability that a job in any individual occupation has at least one nontechnical barrier to automation displacement.
- The probability that a job in any individual occupation is at least 50% automated and faces no nontechnical barriers to automation displacement.
Once calculated, we combine these probabilities with occupation-level May 2025 BLS OEWS employment data, which allows us to produce estimates for the share of employment that meets any of these conditions, both for individual occupations and for aggregated groups of interest (e.g., overall employment and employment in major occupational groups).
Unfortunately, precisely estimating the probabilities listed above requires a significant amount of data, so in general, we are unable to rely exclusively on direct evidence to estimate these values for each individual occupation. Instead, we adopt an adaptive, proximity-based estimation method in which values for any given occupation are obtained by combining direct evidence (i.e., survey responses from people in the occupation in question) with data from respondents who are in sufficiently similar occupations.
In this approach, all final estimates for a given occupation are weighted averages in which the weights depend on two characteristics. First, respondents whose occupations are most similar to the occupation in question receive more weight. Occupational similarity is determined using an occupational similarity matrix based on the general work activities module from O*NET version 30.3. The second factor determining each observation’s weight is a reliability adjustment that gradually reduces the weight given to observations as their reported task automation and/or AI usage percentages become increasingly extreme relative to the distribution of values observed among respondents who are in occupations sufficiently similar to the occupation of interest. The details underlying these calculations will be provided in the forthcoming methodological appendix.
1. This structure is exactly what was used in the 2025 survey, except that the 2026 version added the “organizational constraints” category as an option. The logic behind this addition is that automation displacement requires a significant degree of organizational buy-in to occur.